
75 Comics Categorized "Step #5 – Show me the data! My conclusion is …" (page 3 of 4)
Now that you have attempted/achieved ‘flying’ with your psychological practice, it’s time to show us a stick figure scene of your evidence-based conclusions. What do your 14 days of data — dependent measures (e.g., happiness, productivity, energy) — reveal about the effectiveness of your psychological practice. Note: you may include a cartoon sketch of the graph of your data. You will also submit an APA style graph of your data with your full report.
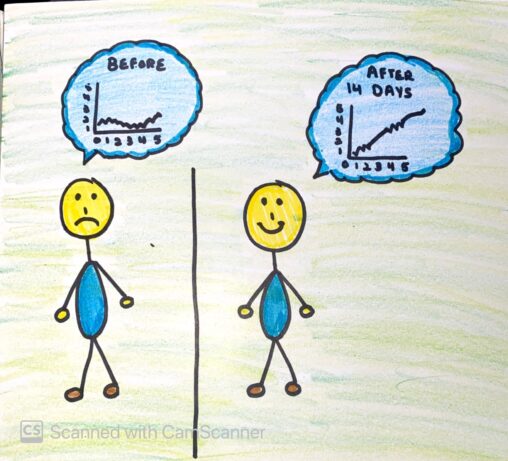
After fourteen days of my psychological practice, I feel like it didn’t change as much as I would have liked. Seeing both graphs made me realized that my…
In terms of my wellness practice being energy, I am happy with my results. Of course I could do a better job as I continue with my wellness…
I felt that at the end of the day and of this experience, all of my data accumulated together showed an upward trend. I was happy despite having…
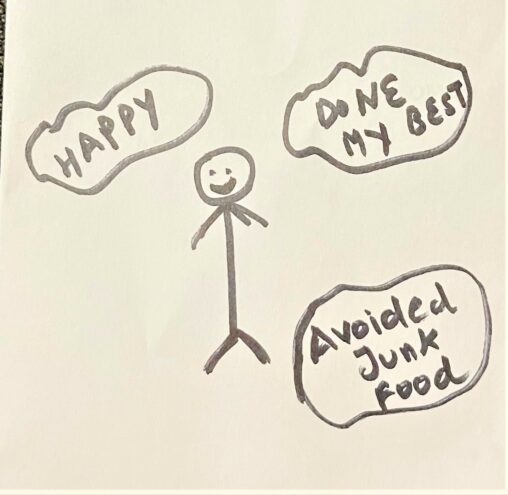
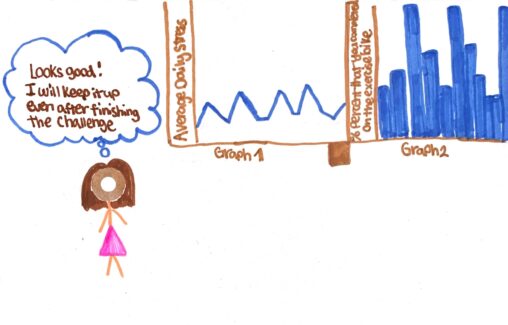
In this comic, we can see that i am very happy because i have achieved the expected results from the get cape project. I have improved my eating…
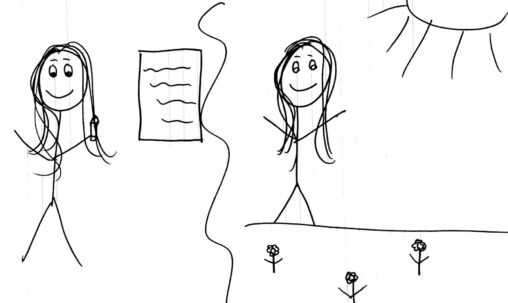
One side the stick figure is holding a pencil and writing for her school writing piece and the other side the stick figure is taking a break and…
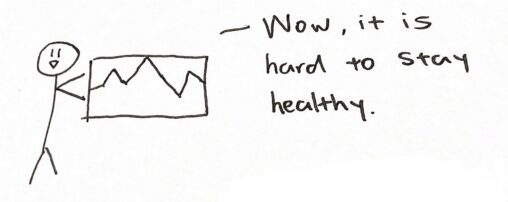
When I saw my line graph of these two weeks, I figured out that it is difficult for a person to change their habits. It has been a…
The stick figure is calculating the whole data in his mind after the day 14 with the goal of running and completing the goal.
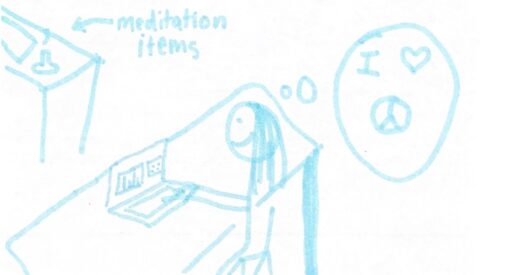
My comic shows how while seeing my data I realized daily meditation suits me well and I can see improvements in my anxiety levels. I also found I…
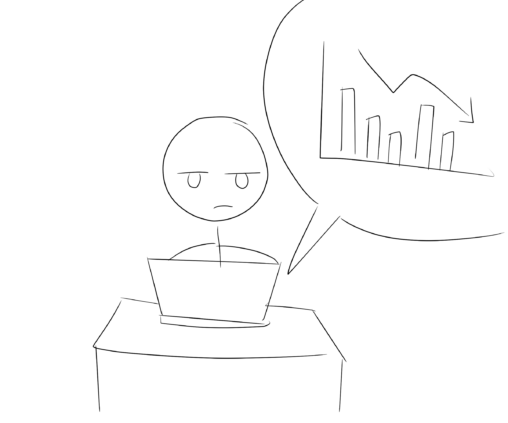
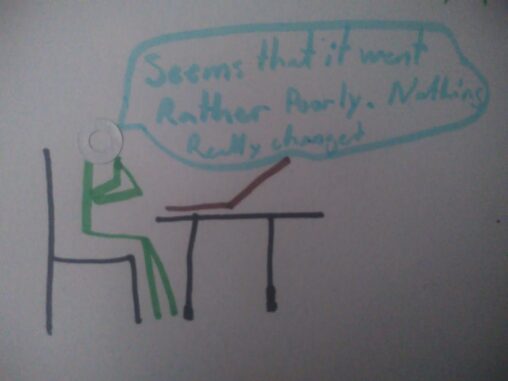
When I was going over the data from my Get Cape, I saw that I never changed much over the whole thing (So long as you ignore the…
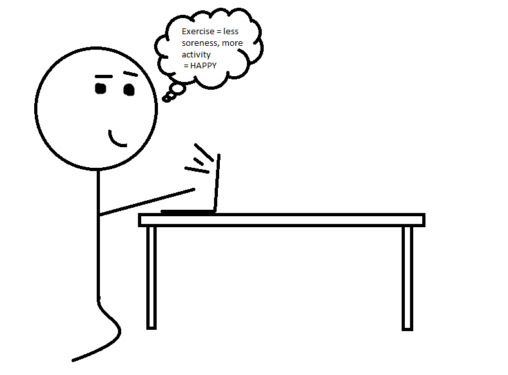
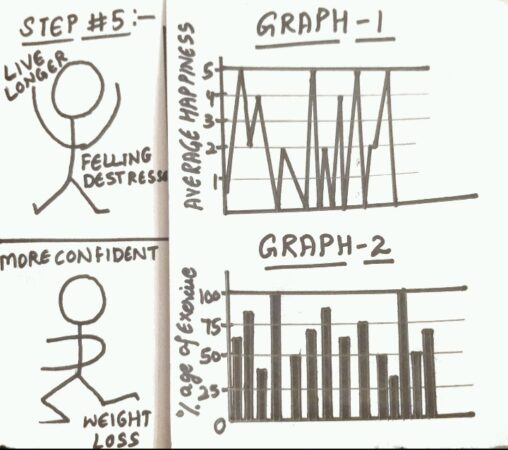
After a long 14 days I am looking at my data and realizing that exercise is not only going to help with tiredness, laziness, but it will help…
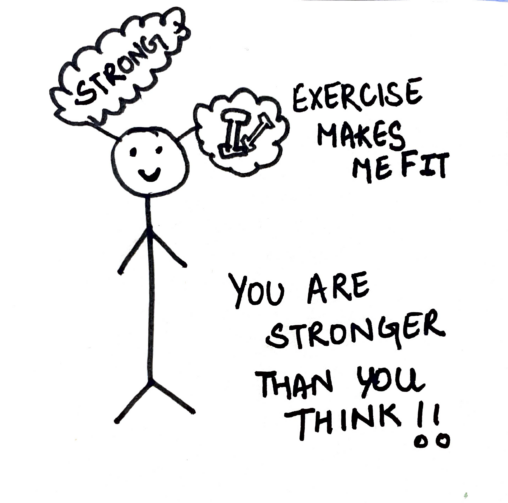
In my comic i am realizing that i have done a lot and i am stronger than i seem , i often underestimate my will power but it…
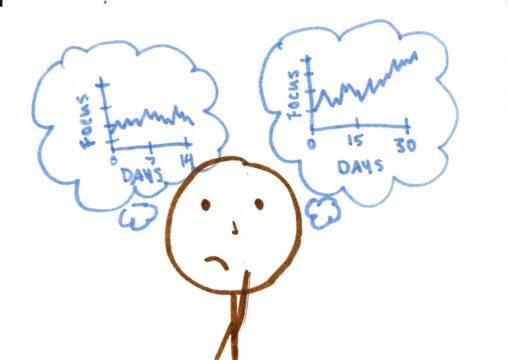
The main thing I concluded from looking over my results was that a study needs to be at least a month long to reach more conclusive results. The…

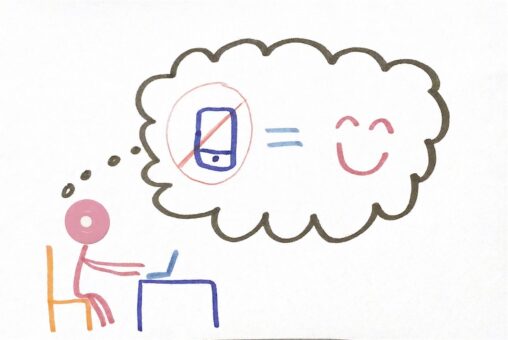
The comic shows my conclusion – that exercise does really equal happiness! I am being mildly dramatic with the six pack imagery, but you get the idea. I…
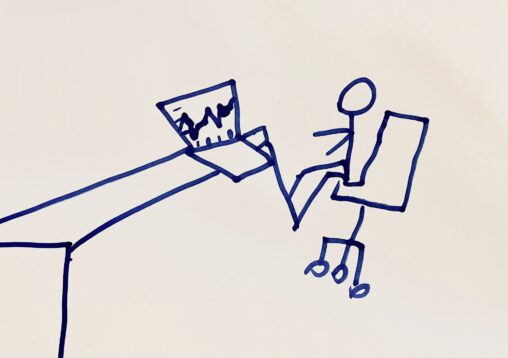
In my comic, I am working on my laptop analyzing data. As I am looking at my data I start to realize that at the points throughout the…
According to the results of two graphs, now I’m looking happy and less stressed by doing different exercises. I have changed a lot and I mostly got the…
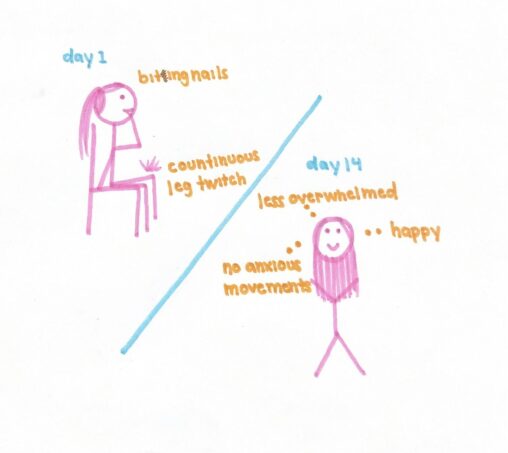
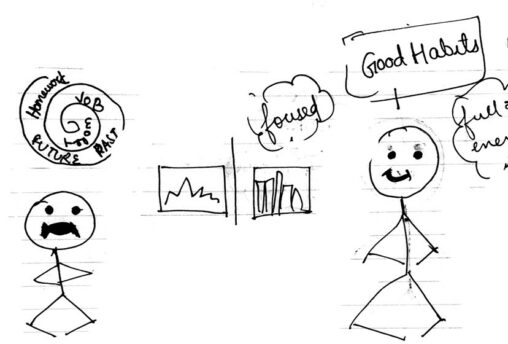
In this comic I am showing how I felt on my first day of my wellness practices. I had very bad anxiety and bad habits. Although throughout the…
After my 14 days with mindfulness, I didn’t feel like it changed a lot, but in some ways, it had its pros. I found out doing my research…
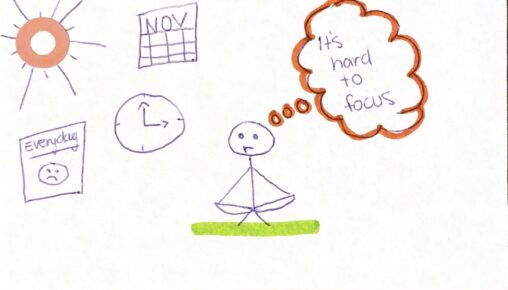
in this comic, according to the results of two graph shows the up down movement in the focused/distraction variable as sometimes it decreases due to overthinking and sometimes…
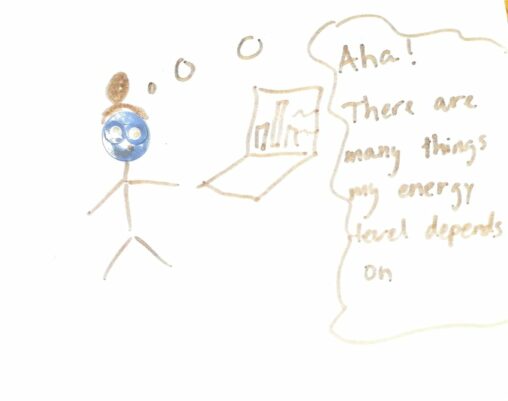
My comic illustrates how the variables in my research are connected. Throughout my daily meditation research project I found outside variables to greatly influence my ability to complete…