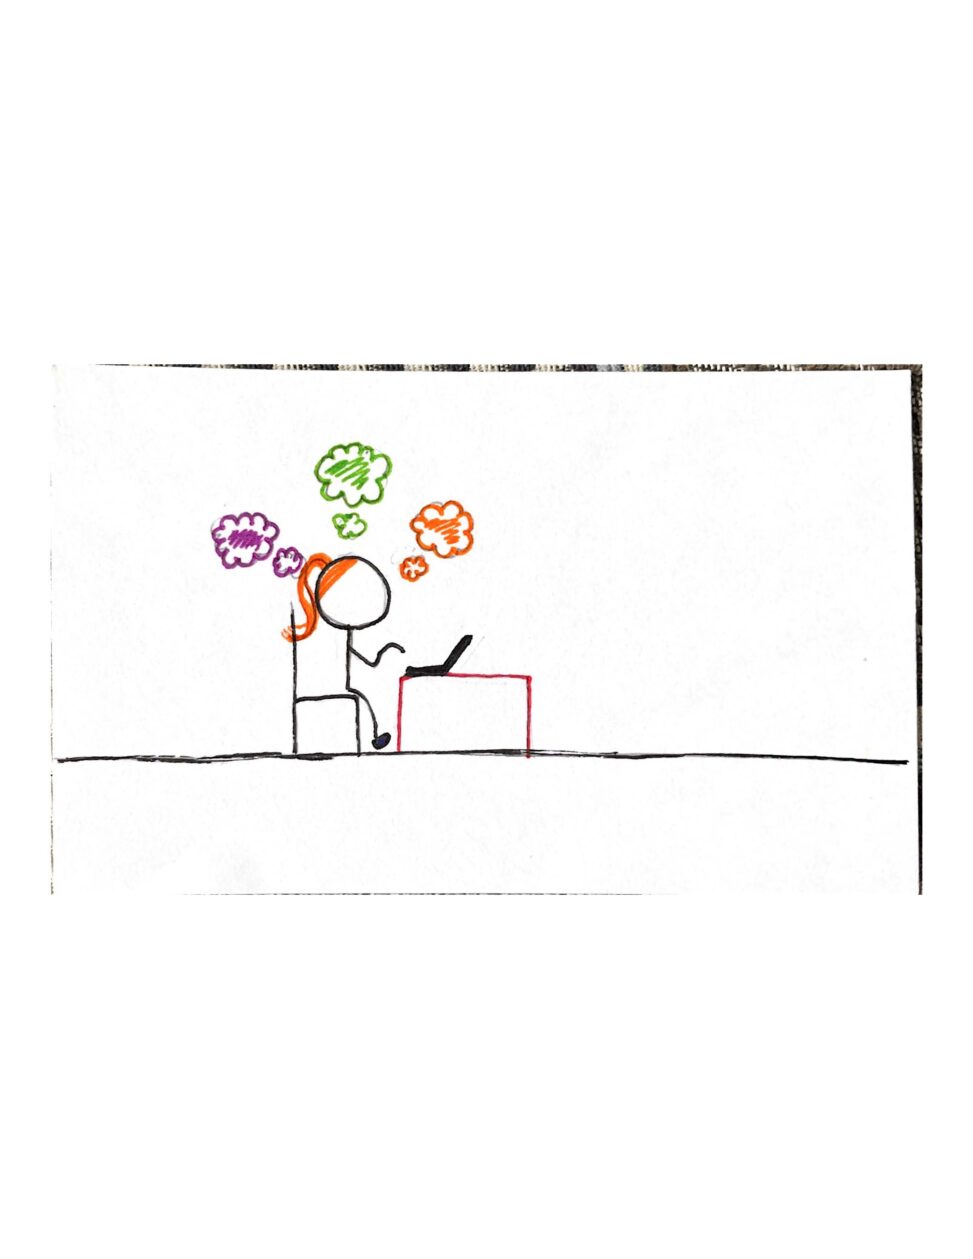
This was when I was sitting at my computer looking at my data from over the 14 days. The thought bubbles are representing different thoughts and feelings I have towards my data now that it’s been charted. They are colourful because the results are either similar or higher than what I first expected, which makes me happy.