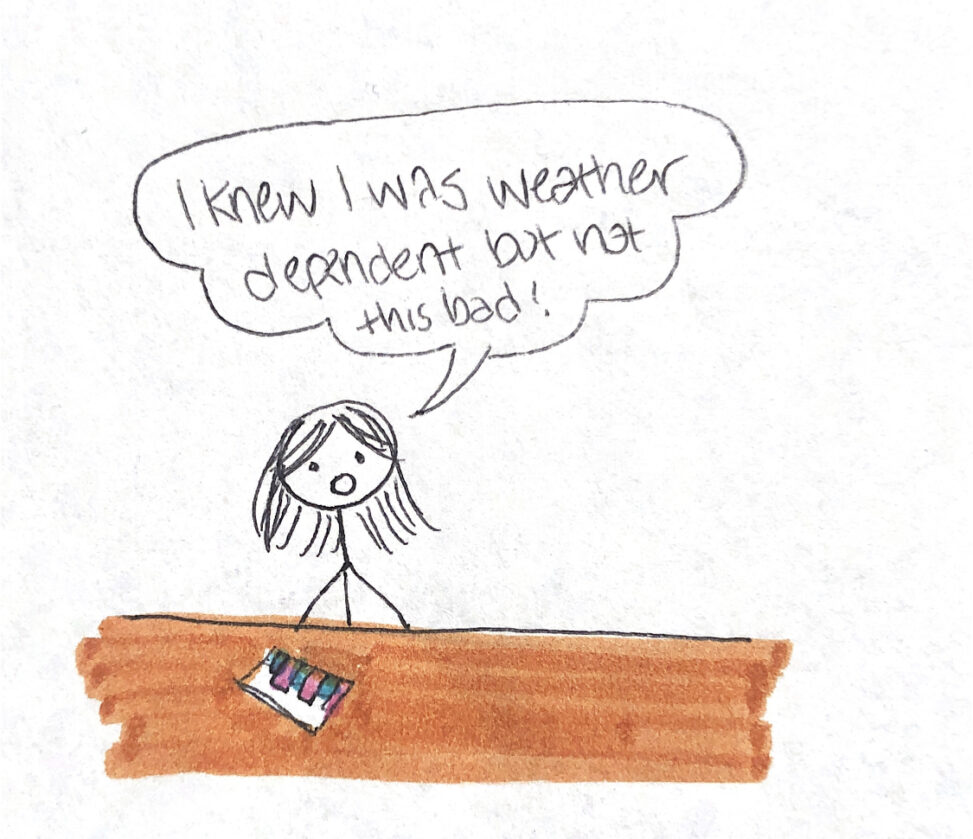
In the comic, you see me at a table looking at the graphs which shows my results over the last two weeks. The reason I am shocked is because having a visual representation of my success rate helped me conceptualize my set backs being most likely bad weather. It’s interesting to see and re analyze myself knowing how strong my intentions were at the beginning of the two weeks.

